Assessing the Population-Level Effects of MPAs
A summary of Ovando et al. (2021)
If you’ve ever spent time exploring a part of the ocean protected from fishing you’ve probably been struck by the amazing abundance of marine life living there. These places, currently covering between 3-7% of the world’s oceans, are a form of Marine Protected Area (MPA). MPAs can be a powerful conservation tool, and there is a growing movement to expand MPAs to cover 30% of the world’s oceans by 2030. However, actually measuring the effect that MPAs have on fish populations can be very difficult, due to the ability of both fish and fishermen to move great distances. This means we have surprisingly little empirical evidence of the effect of MPAs on fish populations across seascapes.
In Ovando et al. (2021) we explored three questions:
How do MPAs affect fish populations?
How can we detect these effects?
What evidence for those effects did we see in the Channel Islands National Marine Sanctuary, USA?
We found that except for large MPAs on heavily overfished species, the total effects of MPAs on fish populations both inside and outside their borders are likely to be small and extremely hard to detect. We demonstrated this using data from the heavily studied and moderately exploited fish populations living in and around a large MPA network in the Channel Islands National Marine Sanctuary, California, USA. After 14 years we found no clear effect of this MPA network on a group of finfish targeted by fishing, with the data supporting an effect ranging from a moderate benefit to a moderate loss. Using computer simulations we showed that this result is actually to be expected, and highlight ways that communities can plan for and potentially overcome the challenge of detecting the seascape-level effect of MPAs on fish populations. It is particularly critical that we expand vital long-term MPA monitoring programs beyond ecological data to include monitoring of human dimensions.
![Map of the study region in the Northern Channel Islands, California (USA) (shading, binned number of Partnership for Interdisciplinary Studies of Coastal Oceans [PISCO] sampling events over the study period)](https://conbio.onlinelibrary.wiley.com/cms/asset/4d20ecee-c6e9-447b-ab77-04a7477c5b44/cobi13782-fig-0005-m.jpg)
Figure 1: Map of the study region in the Northern Channel Islands, California (USA) (shading, binned number of Partnership for Interdisciplinary Studies of Coastal Oceans [PISCO] sampling events over the study period)
How do MPAs affect fish populations?
First off, what do we mean by a “population?” We generally define populations as a group of animals connected by movement and reproduction. We are used to thinking about this in the context of mating, and so might consider a population as being defined by the movement range of a group of sexually mature fish. However, the larvae of many fish species can travel vast distances, sometimes dispersing hundreds of kilometers over many months. This means that seemingly distant groups of adult fish can in fact be part of the same population, connected both through adult movement and larval dispersal. By “population-level effects” then, we are talking about the effect of MPAs not just on the adult fish that happen to live inside protected areas, but the net effect of MPAs across entire connected fish populations both inside and outside their borders.

What effect then should we expect MPAs to have on fish populations? This might seem like a somewhat pointless question. MPAs can prevent fishing within an area, and all else being equal, if you kill fewer fish there are more fish left over in the water. Question answered! So why study this? Well it turns out that predicting how much the creation of an MPA will affect fish populations can be surprisingly difficult. One obvious factor in this equation is how heavily fished a population would have been without an MPA; all else being equal the more heavily fished a species is the larger and more rapid the effect of an MPA will be. Movement creates another important complication, both fish and fishing fleets have a habit of moving, often a lot. Many fish range across tens to thousands of kilometers at some point in their life history, and this dispersal means that MPAs can act as a source of adult or larval fish to unprotected areas outside their borders, potentially providing conservation benefits there. But, this same movement can dilute the protection provided by MPAs, exposing animals to greater amounts of fishing as they spend time outside of protected waters.
But, fish movement isn’t the only thing we have to worry about. Suppose that an MPA is placed on some prime fishing grounds near a harbor. The fishers that used to work those waters have two choices: either leave the fishery, or start to fish harder in the waters outside the MPA. If they choose to to move rather than leave, this will increase fishing pressure outside the MPAs, creating a balancing act between the conservation benefits of fishing less inside the MPA and the conservation losses of fishing harder outside the MPA.
We built a computer simulation to explore the ways in which these and other factors such as MPA design and life history impact the effects of MPAs on fish populations that you can explore here. The results of this are shown in Figure 2. There’s a lot to unpack here, but three important results are that
MPA networks covering 30% or less of a population’s range are unlikely to have large population-level effects unless the fished populations are very overfished and
An MPA of a given size can have a wide range of effects depending on the specific ecological and economic dynamics of that system
It is actually possible for MPAs to cause a net decline in population biomass, though increases are more likely to occur
This last point is surprising. We’re used to thinking about MPAs in terms of how much conservation benefit do they provide, not are there conservation benefits. These simulated losses in total biomass result from a very specific set of economic conditions: when fishing communities try and maintain a specific volume of catch. If for example a subsistence fishery needs to maintain a certain amount of catch, they may have to fish so hard outside the MPA to feed their community that they cause a net decrease in fish biomass, even accounting for the amount protected in and exported by the MPA. This was not a common occurrence in our simulations, but it is possible, and is one reason why monitoring of fishing patterns before and after MPAs is critical.

Figure 2: Simulated population-level effects of MPAs. Panel (a) shows median simulated population-level (pop.) MPA effect sizes as a function of percent of species’ range inside MPA (y-axis), and pre-MPA depletion (x-axis). Pre-MPA depletion is a measure of fishing pressure, where 0% means that the population is unfished, and 100% means that the population is extinct in the time period immediately prior to MPA implementation. Panel (b) shows distribution of simulations across range of MPA sizes and pre-MPA depletions separately
How can we detect MPA effects?
Now that we have a sense for what to expect from MPAs under different conditions, how can we actually detect those effects in the real world? The most common strategy is to find a comparison site that is as similar to the MPA (for example same types of habitat and fish species) as possible, except that it allows fishing. Researchers can then compare things like the abundance of fish inside the MPAs relative to the abundance of fish in these “control” sites. If the biomass of fish inside the MPA is much greater than the biomass of fish in selected site outside the MPA, this can be taken as evidence that the MPA is providing a conservation benefit, particularly if we have data at both sites both before and after the MPA was put in place. Studies such as Lester et al. (2009) looked at these ratios at hundreds of study sites and found on average much higher biomass levels inside MPAs than outside.
What does this actually tell us though? The problem is, this comparison assumes that the selected sites outside the MPA aren’t affected by the MPA. But, in order to find good ecological controls, fished sites used in these comparisons are often located relatively nearby to the MPA. This means that they can be affected by the MPA by the very benefits that MPAs are hoped to produce: spillover of adults or larval fish. MPAs can also affect nearby sites by displacing fishing effort, meaning there is actually more fishing outside the sites than their would have been without MPAs.
To assess the potential impacts of this, we looked at our simulated fisheries and calculated the true effect that our simulated MPAs had on total population biomass. We then compared these values to the ratio of the biomass densities inside the simulated MPAs to biomass densities outside the simulated MPAs. When the control sites outside the MPA aren’t affected by the MPA, these inside-vs-outside measurements are a good indicator of the true effect of the MPAs on total biomass of the population. But, when the MPAs affect the fished areas, this ratio actually becomes a very poor predictor of the MPA effect(Figure 3). When adult fish movement is low, we often see really big differences between biomass inside MPAs relative to outside, despite the actual effect on the population being much smaller. But, when movement is high, we often see very little difference inside vs outside MPAs, despite there often being a large actual effect.
So, comparing measurements from inside MPAs to outside can be a good indicator that the MPA is providing protection insides its borders. But, if the control sites are affected by the MPA, either positively by export of fish, or negatively by displacement of fishing effort, these measurements might actually tell us very little about the effect of the MPA on the entire population.
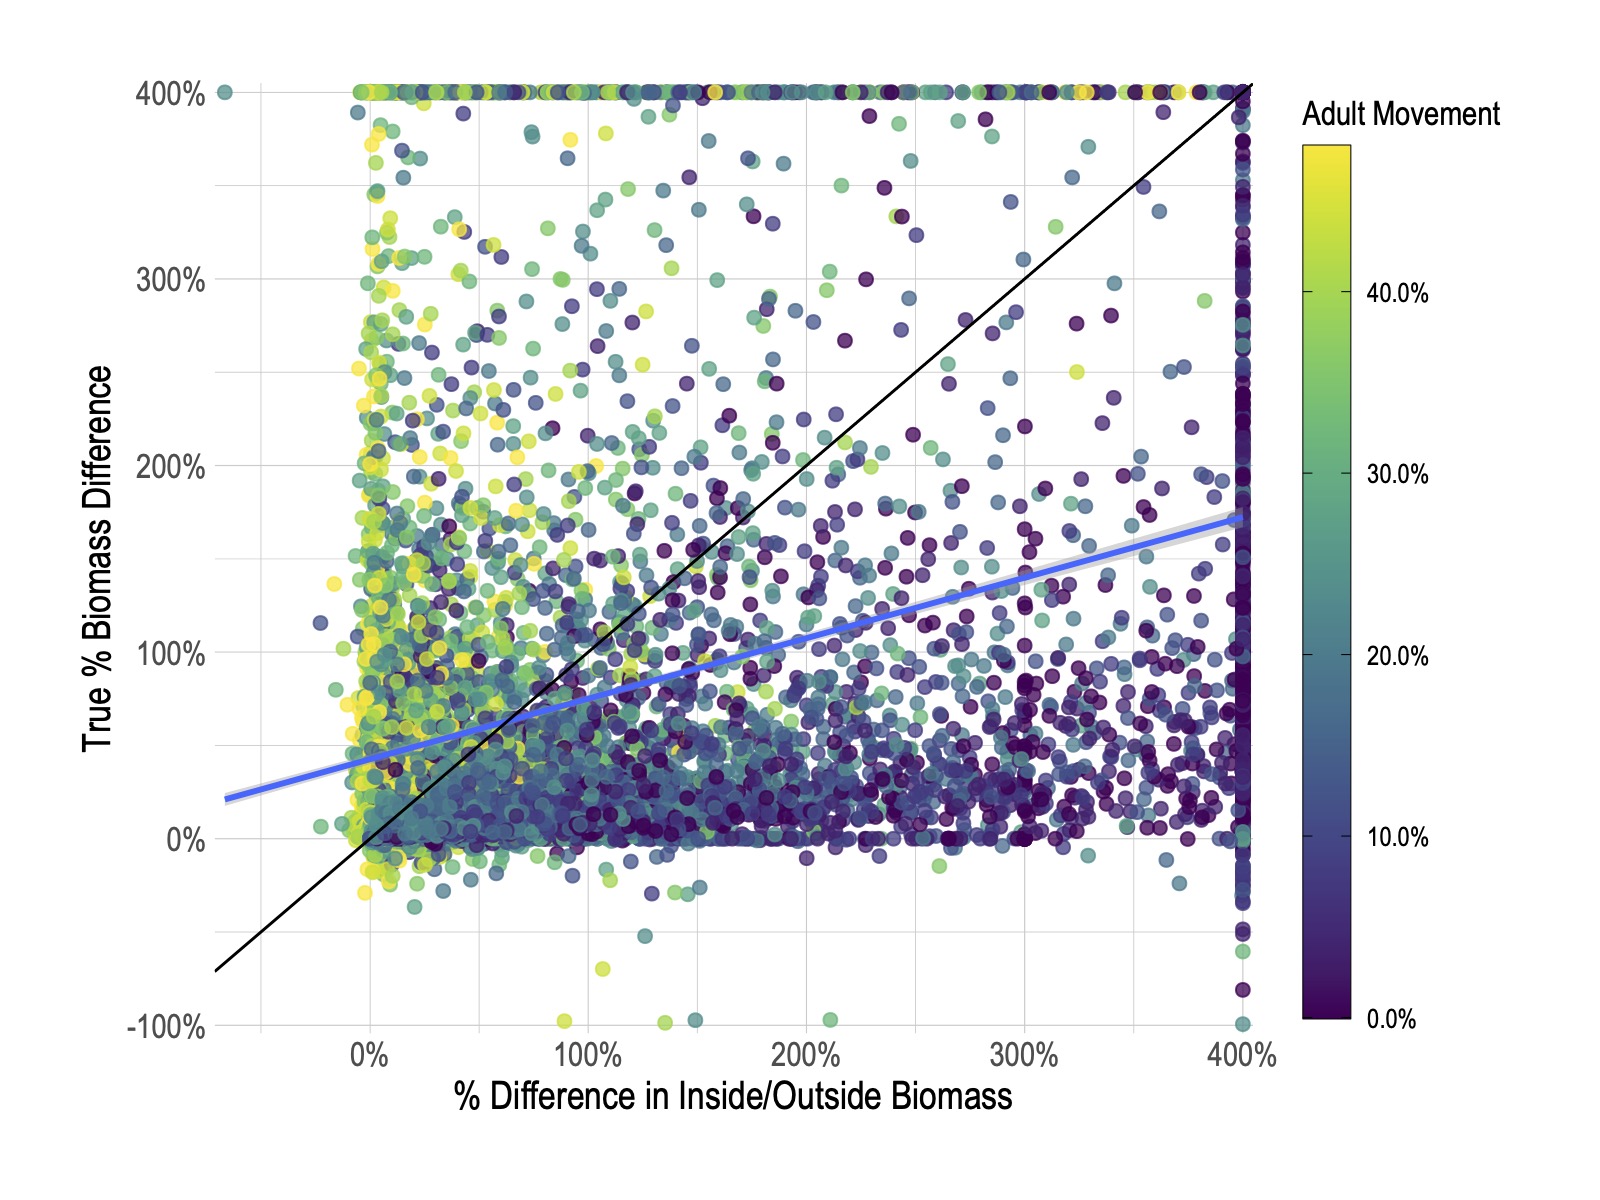
Figure 3: True effect of MPAs on total population biomass (vertical axis) plotted against ratio of biomass inside MPAs relative to outside. Each point is a simulated fishery, and color of the points corresponds to the movement rate of adult fish.
So how can we estimate the effect of MPAs on fish populations if inside-vs-outside isn’t always reliable for this task? We took a different approach, deciding to compare trends in biomass densities between two groups of species: those targeted by fishing (think snapper) and those not targeted by fishing (think Nemo). Our theory is that, since fishing mortality rates are likely to be much higher for targeted species than non-targeted, the non-targeted species might serve as our control for other changes in the ecosystem, such as warming events.
Looking at the data, the two groups of fish had very similar biomass trends before the MPAs, which is evidence that our theory may hold (Figure 4. We then statistically compared the difference in these trends using a model that accounts for things like the experience of the divers conducting the surveys that provided the data and changes in local water temperature.

Figure 4: Centered and scaled trends in biomass densities of targeted (solid lines) and nontargeted (dashed lines) fin-fish included in our study of the Channel Islands Marine Protected Area (MPA) network: (a) mean trends across all sites and the same trends for sites only (b) outside and (c) inside MPAs (shaded areas, 95% confidence intervals; vertical dotted line, MPA implementation in 2003)
What evidence for those effects did we see in the Channel Islands?
So what did we find? We estimated that the MPAs in the Channel Islands had an overall uncertain but positive effect from 2003 to 2009. But, that trend reverses itself from 2009 to 2018, and in the most recent time step we don’t estimate any clear effect of the MPAs on total biomass of targeted finfish included in our study. The data and model say that there is some probability of a small positive effect, but a roughly equal probability of a small negative effect (Figure 5).
So what happened here? We didn’t see evidence of a “constant catch” fishing behavior in the region that might explain this decline, so that possibility suggested by our simulation modeling seems unlikely. Instead, we think what happened is that a marine heatwave that started around 2009 may have had a larger effect on the targeted species, which in the Channel Islands often prefer cooler waters, than the non-targeted species, and that given the effect size of the MPA this environmental shock was large enough to mask the signal of the effects of the MPAs on fish biomass.
![Results of difference-in-difference regression estimating the population-level effect of the Channel Island Marine Protect Area (MPA) on mean total biomass densities of targeted species. Gray distributions show posterior probability distribution of estimated MPA effect; red point is median estimated effect, thicker red line 50% credible interval, and thinner red line 90% credible interval. Blue distributions in background show range of MPA effects produced by simulation model tuned to reflect the dynamics of the Channel Island MPAs (black dashed line is median simulated value). Results are estimated in blocks of 3 years, with notation of (2003,2006] indicating that that block includes years ≥2003 and <2006. MPAs were implemented in 2003](https://conbio.onlinelibrary.wiley.com/cms/asset/f49aefdf-5480-4d14-8135-12dea9ff99b7/cobi13782-fig-0002-m.jpg)
Figure 5: Results of difference-in-difference regression estimating the population-level effect of the Channel Island Marine Protect Area (MPA) on mean total biomass densities of targeted species. Gray distributions show posterior probability distribution of estimated MPA effect; red point is median estimated effect, thicker red line 50% credible interval, and thinner red line 90% credible interval. Blue distributions in background show range of MPA effects produced by simulation model tuned to reflect the dynamics of the Channel Island MPAs (black dashed line is median simulated value). Results are estimated in blocks of 3 years, with notation of (2003,2006] indicating that that block includes years ≥2003 and <2006. MPAs were implemented in 2003
The Take Home
So what did our study show? We found that the effects of MPAs at the population level may be smaller and harder to detect than you might expect. While signals may be clearer for highly overfished species, which are common in many parts of the world, even there unless MPAs are relatively large relative to the movement rate of species we this means that we might struggle to estimate the actual effect of MPAs on fish populations.
Comparing measurements inside and outside MPAs can be very useful, but unless carefully designed might not actually tell us much about population-level effects of MPAs. Including data on fishing behavior and fishery catches in long-term monitoring programs can greatly help interpret data coming out of a system. In particular, it can help determine how valid areas outside the MPA may be as control sites, and help monitor for the potential of unintended negative conservation consequences caused fishing communities attempting to maintain a fixed level of catch.
Based on our simulation results, we might expect it to be hard to detect a relatively small MPA effect in a complex ocean environment, even in a well-studied place like the Channel Islands. This is exactly what we found. It is really important to be clear though that this doesn’t mean that the MPAs didn’t have a positive effect in the Channel Islands: just that the signal is messy enough that it’s hard to say exactly what effect they had.
MPAs are an important conservation tool, and can often produce large conservation gains. But, actually detecting these gains can be complicated, and it can be easy to accidentally miss them, or to overestimate them. We go into some solutions to these problems, the the reality is that detecting the population level effects of MPAs is likely to be a challenge in many places. Clearly communicating what to expect from and what can be detected from MPAs is critical to ensuring that MPAs play effective roles in fisheries management and marine conservation.

Share this post
Twitter
Facebook
Reddit
Email