Improving estimates of the state of global fisheries depends on better data
A summary of Ovando et al. (2021) "Improving estimates of the state of global fisheries depends on better data"
Summary
There is a saying adapted from the fisheries scientist John Shepherd that managing fisheries is just like managing trees except they move and you can’t see them. This means that actually figuring out how many fish are in the water can be very difficult, and determining what sustainable levels of harvest are likely to be even more challenging. In Ovando et al. (2021), we looked at the potential for models based largely on the volume and shape a fisheries catch history to estimate the state of global fisheries. We found that overall they performed poorly, better than a random guess, but often biased and imprecise. What does this mean going forward? Assessments provided by the FAO’s State of World Fisheries and Aquaculture (SOFIA) report, based more on expert elicitation than catch-only modeling, provide the current best estimate of the state of global unassessed fisheries. Improving estimates of global unassessed fisheries from this baseline depends on collection of targeted data types and local capacity building.
Background
Fisheries with lots of data and resources utilize statistical models called “stock assessments” to solve these problems, providing managers with estimates of current biomass, \(B\), relative the the biomass that would be expected to support maximum fishery yields on average over the long term, \(B_{MSY}\), a ratio referred to as \(B/B_{MSY}\). The Food and Agriculture Organization of the United Nations (FAO) breaks fisheries into three categories based on \(B/B_{MSY}\): underfished (\(B/B_{MSY} \geq 1.2\)), maximally sustainably fished (\(0.8 \geq B/B_{MSY} < 1.2\)), and overfished (\(B/B_{MSY} < 0.8\)).
The FAO’s State of World Fisheries and Aquaculture (SOFIA) report is the most widely used primary source for tracking the global state of fisheries. The latest SOFIA report, covering 70% of the landings of all fisheries in the world, estimates that as of 2017, 59.6% of marine fish stocks are maximally sustainably fished (at or near targets for sustainable food production), 6.2% are underfished, and 34.2% are overfished (FAO 2020). Where possible, these statements about the status of individual fish stocks are made on the basis of formal stock assessments summarized in the RAM Legacy Stock Assessment Database (RLSADB). The “assessed” fisheries in RLSADB represent roughly 50% of global capture as of 2020 (Hilborn et al., 2020) and represent our best estimates of the state of assessed fish populations around the globe.
That leaves roughly 50% of global landings, and the majority of global fisheries, as currently “unassessed.” While these unassessed stocks are generally individually smaller and less economically valuable than the fish populations in the assessed category, collectively they are a vital source of food, employment, cultural value and ecosystem services around the world. The SOFIA report includes unassessed stocks and bases its estimates for these fisheries on data-limited methods or qualitative expert opinion for each region where these stocks are distributed (FAO, 2020).
But, given the importance of these unassessed fisheries, a large number of studies have tried to come up with more quantitative tools for estimating \(B/B_{MSY}\) values in unassessed fisheries. Catches reported from fisheries are the only consistently available source of data for fisheries around the world. So, a large number of studies have tried to develop various types of “catch-only” models that try and estimate stock status based basically on the volume and shape of a fishery’s catch history, expert knowledge, and life history information.
What did we do?
We developed a new stock assessment model and R package called sraplus to test the ability of catch-only models, augmented with different kinds of data, to provide accurate estimates of stock status for global fisheries.
This model used different types of broadly available information including the catch histories themselves, data on strength of fisheries management, trawl fishing intensity, and reconstructions of fishing effort. We then compared estimates of \(B/B_{MSY}\) made by sraplus using these broadly available data, along with the default settings of CMSY, another widely used catch-only model, to the best available estimates of \(B/B_{MSY}\) from the RAM Legacy Stock Assessment Database. The idea here was to approximate a “regional level” assessment process, where we have catch data for individual fisheries, but we only have general regional level estimates of things like strength of fisheries management.
What did we find?
Overall we found that the catch-only style models tested here provided generally biased and inaccurate measures of stock status. For one of our tests, we used data directly from each fishery in the RLSADB. This provides an estimate of the best that this model could possibly do, given that it is a highly simplified representation of the population model used in the actual stock assessment for each fishery, with a mean absolute percent error (MAPE) of 29%, and accurately classifying fisheries into the correct FAO status bin 69% of the time.
Error, bias, and accuracy performance dropped quickly after that though. The catch-only style estimates of fish populations on average performed 25% better than a random guess. But, on average, these methods assigned fisheries to the wrong FAO status category 57% of the time. Within these broad summaries, the performance of models trained on our tested data sources varied widely across regions, with no clear patterns such as individual models consistently performing better for particular areas or species groups.
| Data Used | MPE | MAPE | Accuracy |
|---|---|---|---|
| RLSADB Index | 0.14 | 0.29 | 0.69 |
| FMI | -0.09 | 0.47 | 0.42 |
| SAR | -0.04 | 0.50 | 0.38 |
| Effective CPUE+ | -0.30 | 0.52 | 0.43 |
| Nominal CPUE+ | -0.01 | 0.52 | 0.46 |
| CMSY | -0.54 | 0.60 | 0.41 |
| Guess | -0.10 | 0.61 | 0.30 |
| Nominal CPUE | 0.05 | 0.63 | 0.48 |
| Effective CPUE | -0.36 | 0.68 | 0.41 |
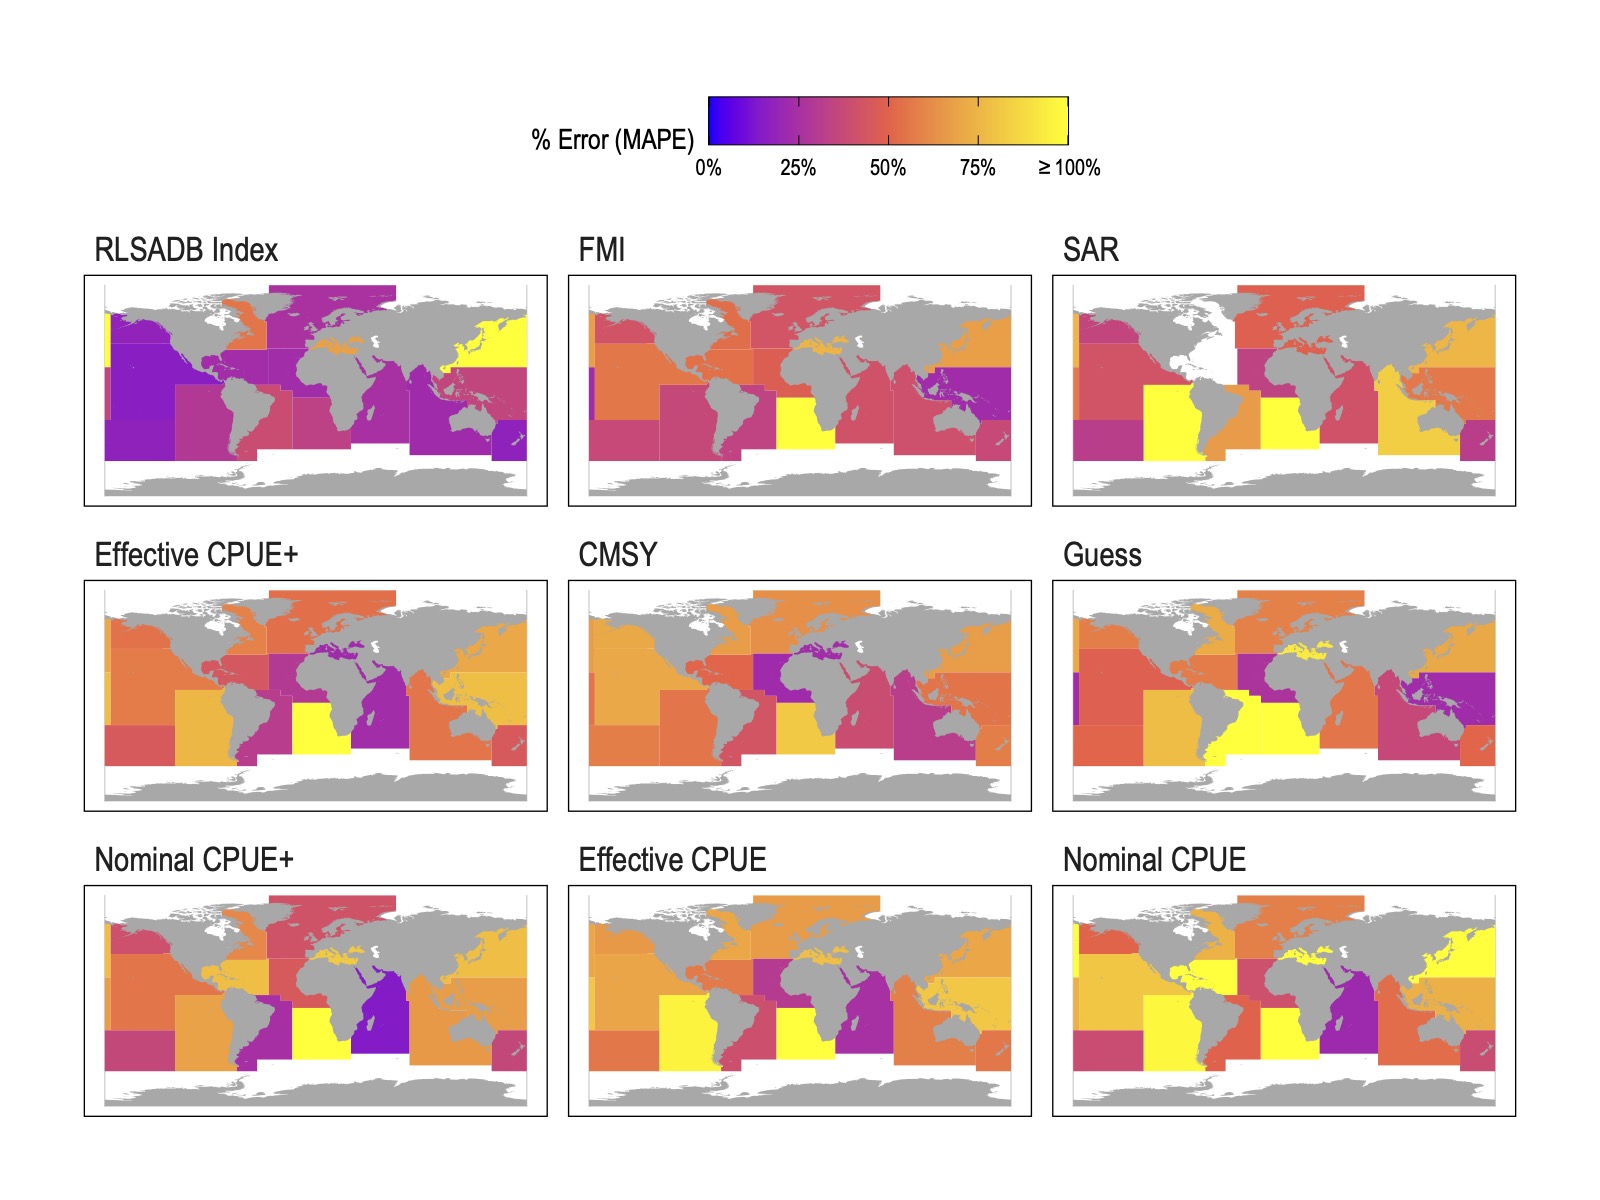
Figure 1: Median absolute per cent error (MAPE) in most recent B/BMSY by FAO statistical area from different data sources. Data source panels are ordered in ascending (starting from top left) mean MAPE at the FAO region level.
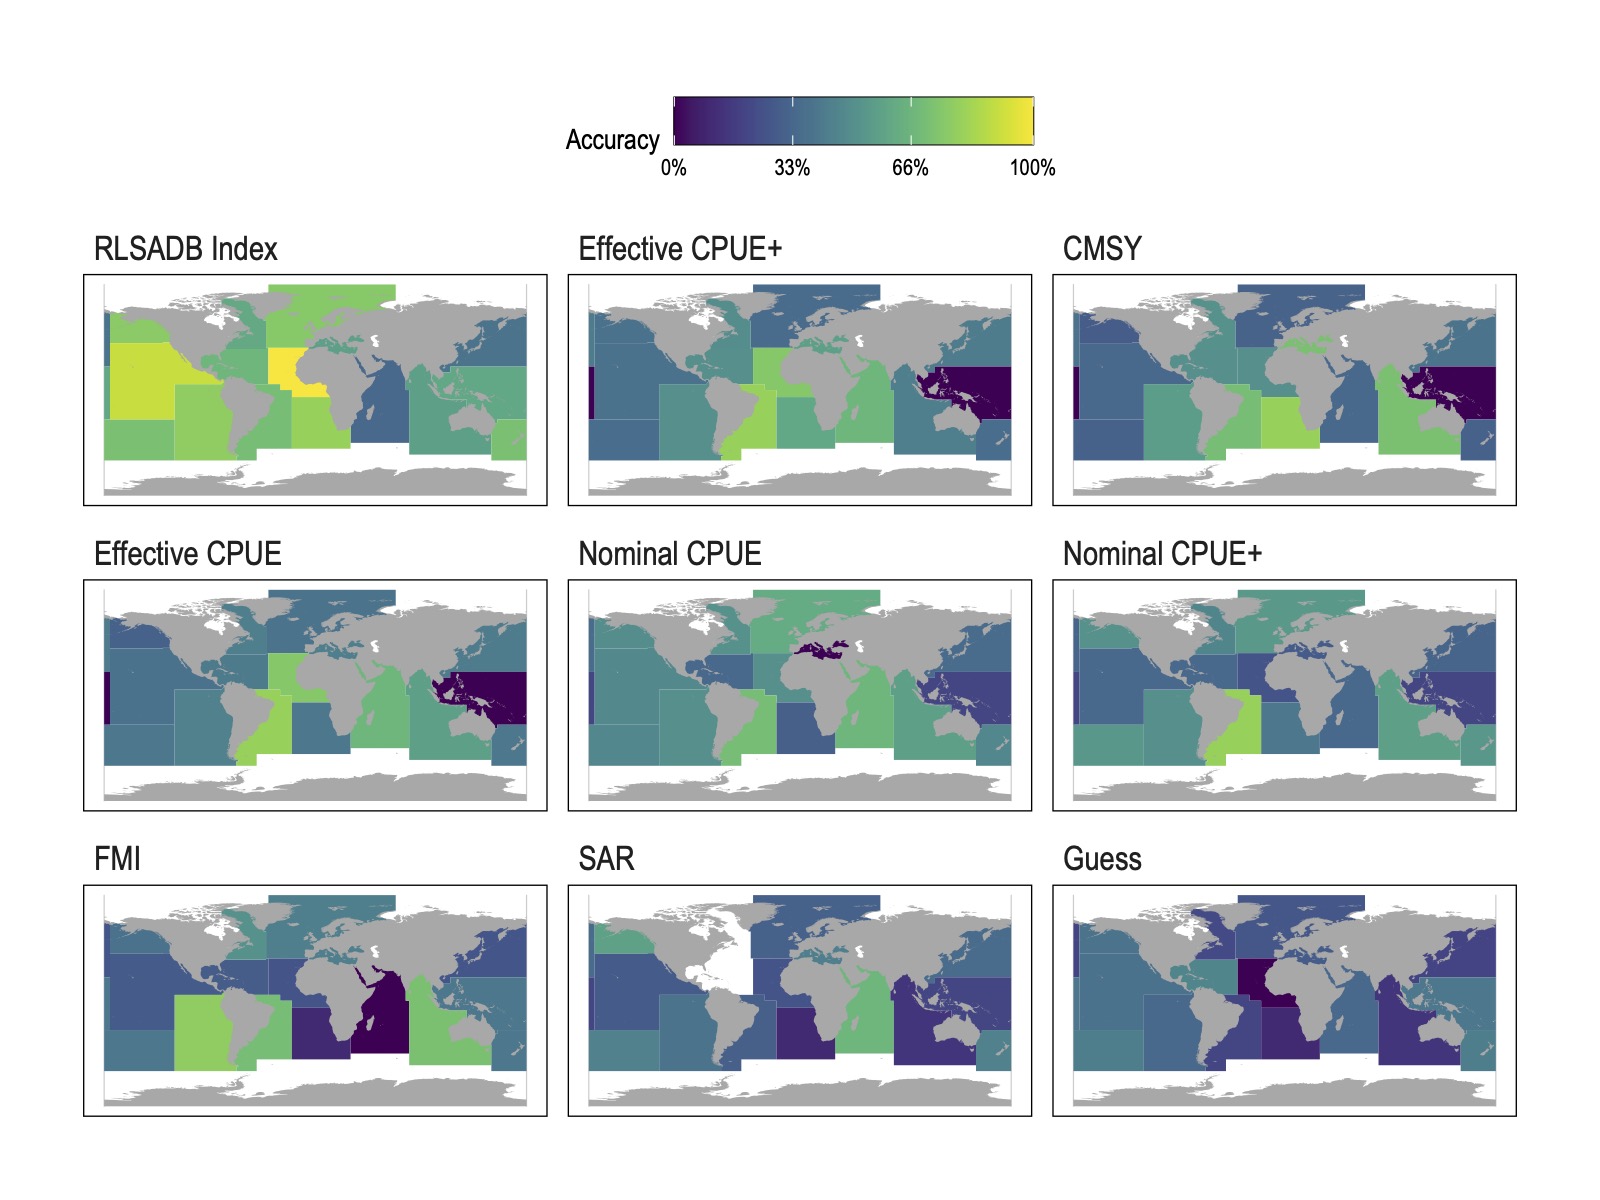
Figure 2: Mean classification accuracy (assignment to FAO stock status category) by FAO statistical area arising from different data sources. Data source panels are ordered in descending (starting from top left) mean accuracy at the FAO region level.
What does it mean?
Overall, we found that catch-only models informed by a range of broadly available datasets performed generally better than a random guess in estimating \(B/B_{MSY}\), but not by much. As succinctly stated by Dr. Halley Froehlich then, “Better than a guess, but not good enough for actual stock-level decision making”.
What does this mean for our knowledge of global fisheries? Lots of really talented groups of scientists have tried to squeeze more information out of currently available data to improve estimates of \(B/B_{MSY}\) for unassessed fisheries. Our study, combined with works such as Free et al. (2020), suggests that there just isn’t much information on stock status to be pulled out of catch histories, even when combined with other regional data.
So how can we assess unassessed fisheries? The FAO’s SOFIA report bases its estimates for these fisheries on data-limited methods or qualitative expert opinion for each region where these stocks are distributed. Baring new sources of data, the current SOFIA estimates are likely to remain the most accurate assessments of global unassessed fisheries: best available evidence suggests that relying on local expert opinion and locally available data, as the FAO’s assessments currently do, is likely to be much more accurate than indiscriminately substituting a more “quantitative” but likely inaccurate and biased catch-only model.
Our analysis does not show that the data considered here are without value, but that attempting to indiscriminately apply these data to all areas of the globe results in meaningfully incorrect estimates of stock status for regions whose nature does not match the assumptions needed to apply these data sources.
Models like sraplus can certainly help users incorporate their knowledge of a specific fishery into a localized assessment. But, achieving meaningful improvements in the assessment and management of global unassessed fisheries that are not based largely on expert opinion will depend on expanded collection of targeted data types, active management and local capacity building.

Twitter
Facebook
Reddit
Email